So, I’ve wanted to have some fun and spend many long hours in the weekend trying to (white-hat 😉 ) crack a random software that comes with an evaluation period 😀 I’ve chosen a not so difficult one which would check against a response from the web for its verification or anything like that, but rather one that just stores a serial number (if entered) locally and just checks that for validation. Anything more complicated would take many, many days, weeks, lives, etc. =))
For the purpose of privacy and so on, I won’t reveal the name of this software and we’ll just name this SomeProc.exe and which is a Win32 x64 native compiled image (PE). The purpose of it is irrelevant, but what is relevant to us here, is that it has a UI and that sometimes makes things simpler. That is because we can just try to check if the UI shows (and it usually does) certain strings like “evaluation“, “register“, etc. – things of this nature. This is important because we can search for these strings in the process itself (unless they have been somehow obfuscated … but at the right point if searching long enough, we might still find them …).
NOTE: I’m using public symbols for the Windows modules, so no “magic” involved: Microsoft Public Symbol Server
Other methods would be using different anaysis tools of what processes do – like tools from the System Internals Suite – more specific usually Process Monitor helps a lot in an initial investigation or even later after already having some hints from other places (like process memory under a debugger, etc.). Another more than great and awesome tool for reverse engineering / malware analysis is IDA – check it out! 😀
Luckly enough, our SomeProc.exe displays the string “evaluation copy” in the UI. That’s a good place to start as any I guess. These types of reverse engineering analysis tasks can take ages and have many trial and error moments which all maybe get you closer to the next clue or just leave you frustrated after many hours.
When it comes to non-native compiled processes (ex. .NET Framework) or others where we can simply use an IL (Intermediate Language) Dissassembler (or whatever decompiler can be used depending on what code we are talking about), things are pretty easy and we can see some relativley clear code (like C# decompiled from IL) and all is good and well. When it comes to native compiled processes (machine code) without having public or private symbols at all, makes for a nice “hunt” in machine code and assembly interpretation fun 😀
Right … so let’s start with looking for strings under the debugger – I’m using WinDbgX and I’m starting the process under it. It breaks just on process startup (before calling “main” (or whatever entry point if it has been changed) from ntdll.dll). ntdll.dll is the user mode wrapper around a process on Windows which handles everything a process needs to start (memory, args, etc.) and which calls the entrypoint of the process (WinPE – Win Printable Executable) and it’s also the one making the calls into Kernel.
So, in order to search the process memory for strings using the memory search functionality of WinDbg, we’ll need to get the addresses (start & end) of where the image was loaded (we might need to search the EXE and each own DLL it uses – we might need to search all it’s images … not only the starting process – EXE). So, let’s get the start & end addresses of our loaded SomeProc.exe image in memory:
0:000> lmtm SomeProc
start             end                 module name
00007ff7`70600000 00007ff7`7091d000   SomeProc    Tue Feb 12 11:24:14 2023 (52FE126F)
Alright, using these now, let’s perform a search for the UNICODE string “evaluation” like so:
0:000> s -u 00007ff7`70600000 00007ff7`7091d000 "eval"
00007ff7`709151ac  0065 0076 0061 006c 0075 0061 0074 0069  e.v.a.l.u.a.t.i.
Niiiice, very lucky, usually it’s not that lucky, but again, I’ve chosen something simple for the sake of this blog post and for not finishing my analysis when I’ll be 80 years old … =)) We can resolve the entire string using “du” which dumps UNICODE strings from a certain memory address (displays until terminating null character 0x0000 – 2 bytes in UNICODE):
0:000> du 00007ff7`709151ac
00007ff7`709151ac  "evaluation copy"
HA! There we go, confirmed, it’s the string that we see in the UI “evaluation copy“. So, what we can do now, is pretty interesting because we would be interested to see where at some point in execution of the code, this memory location will be read … soooo, let’s put a breakpoint of type break on access when 1st byte from this address is being read and then “g” GO to let the process execute and see where we end up:
0:000> ba r1 00007ff7`709151ac

0:000> g
Breakpoint 1 hit
ntdll!memcpy+0x29:
00007ffa`ba6b59a9 420f104c02f0    movups  xmm1,xmmword ptr [rdx+r8-10h] ds:00007ff7`709151ba=00790070006f00630020006e006f0069
Let’s also display the CPU registers and the current stack (@RSP – stack pointer) of the current instruction location (@RIP – instruction pointer):
0:000> r
rax=00007ff7707cd010 rbx=000000000000001e rcx=00007ff7707cd010
rdx=00007ff7709151ac rsi=00000000000003ff rdi=00007ff7707cd010
rip=00007ffaba6b59a9 rsp=000000446e4f6a28 rbp=00007ff770600000
 r8=000000000000001e  r9=00007ff7709150a0 r10=0000000000000001
r11=000000446e4f6a00 r12=0000000000000000 r13=0000000000000000
r14=0000000000000000 r15=0000000000000369
iopl=0         nv up ei ng nz na pe cy
cs=0033  ss=002b  ds=002b  es=002b  fs=0053  gs=002b             efl=00000283
ntdll!memcpy+0x29:
00007ffa`ba6b59a9 420f104c02f0    movups  xmm1,xmmword ptr [rdx+r8-10h] ds:00007ff7`709151ba=00790070006f00630020006e006f0069

0:000> k
Child-SP          RetAddr               Call Site
00000044`6e4f6a28 00007ffa`b8062624     ntdll!memcpy+0x29
00000044`6e4f6a30 00007ffa`ba097ec2     KERNELBASE!LoadStringBaseExW+0xd4
00000044`6e4f6aa0 00007ff7`706a49c9     USER32!LoadStringW+0x12
00000044`6e4f6ae0 00007ff7`70700e26     SomeProc+0xa49c9
00000044`6e4f6b20 00007ff7`70659fb8     SomeProc+0x100e26
00000044`6e4f8360 00007ff7`7070163a     SomeProc+0x59fb8
00000044`6e4fc970 00007ff7`707188c2     SomeProc+0x10163a
00000044`6e4ffaa0 00007ffa`b8ed26bd     SomeProc+0x1188c2
00000044`6e4ffae0 00007ffa`ba66dfb8     KERNEL32!BaseThreadInitThunk+0x1d
00000044`6e4ffb10 00000000`00000000     ntdll!RtlUserThreadStart+0x28
Alright, so this is where the process is loading the string – it’s interesting to see what it would do in the execution after it loads this value which it is doing by calling USER32!LoadStringW from some location inside of it (remember, no symbols – so we only see some OFFSET into the image (start + OFFSET). We can see that we are calling from this location SomeProc+0xa49c9 – so, let’s see the code here:
0:000> u SomeProc+0xa49c9
SomeProc+0xa49c9:
00007ff7`706a49c9 85c0            test    eax,eax
00007ff7`706a49cb 7515            jne     SomeProc+0xa49e2 (00007ff7`706a49e2)
00007ff7`706a49cd 488b0d944c1200  mov     rcx,qword ptr [SomeProc+0x1c9668 (00007ff7`707c9668)]
00007ff7`706a49d4 448bcf          mov     r9d,edi
00007ff7`706a49d7 4c8bc3          mov     r8,rbx
00007ff7`706a49da 8bd6            mov     edx,esi
00007ff7`706a49dc ff155e8f0900    call    qword ptr [SomeProc+0x13d940 (00007ff7`7073d940)]
00007ff7`706a49e2 488b6c2448      mov     rbp,qword ptr [rsp+48h]
We can see that after we load this, we are going to check if the return value of the USER32!LoadStringW function was 0 or something else by doing a “test eax, eax” where EAX means that we are addressing just 32bits of the otherwhise 64bits register RAX (as we are in a x64 process). Note that this is done because by convension, compilers store return values of functions in the “AX” register – here on x64 – the RAX register. So, let’s see if we will jump or not in the next instruction (JNE – “jne SomeProc+0xa49e2“) by checking the value of the register and addressing it in its 32bit form (just like the code does). In oder to do that, we’ll need to “go” there in the execution. There are a couple of ways to do this, but I’ll just chose the easiest one and put a breakpoint on the return address of the call to USER32!LoadStringW which should end up exactly @ SomeProc+0xa49c9:
0:000> bp 00007ff7`706a49c9

0:000> g
Breakpoint 1 hit
SomeProc+0xa49c9:
00007ff7`706a49c9 85c0            test    eax,eax
Yup, here we are, so let’s check the value of EAX as we discussed:
0:000> r @eax
eax=f
Alright, it’s non-zero (0xF) which is expected here as per USER32!LoadStringW documentation, if it does not fail (would return 0), it returns the number of characters in the string + NULL termination character (0xF = 16 => “evaluation copy” + “\0“).
Alright, this hasn’t told us anything we need, but it’s a good place to demonstrate the flow and what to look at here for further reference 🙂
At this point, we are here – when looking into the dissassembly window of WinDbg where we can follow the execution and step through the code to analyze its execution flow:
00007ff7`706a49c3 ff15778f0900   call    qword ptr [7FF77073D940h]
00007ff7`706a49c9 85c0           test    eax, eax
00007ff7`706a49cb 7515           jne     00007FF7706A49E2
00007ff7`706a49cd 488b0d944c1200 mov     rcx, qword ptr [7FF7707C9668h]
00007ff7`706a49d4 448bcf         mov     r9d, edi
00007ff7`706a49d7 4c8bc3         mov     r8, rbx
00007ff7`706a49da 8bd6           mov     edx, esi
00007ff7`706a49dc ff155e8f0900   call    qword ptr [7FF77073D940h]
00007ff7`706a49e2 488b6c2448     mov     rbp, qword ptr [rsp+48h]
00007ff7`706a49e7 488bc3         mov     rax, rbx
00007ff7`706a49ea 488b5c2440     mov     rbx, qword ptr [rsp+40h]
00007ff7`706a49ef 488b742450     mov     rsi, qword ptr [rsp+50h]
00007ff7`706a49f4 4883c430       add     rsp, 30h
00007ff7`706a49f8 5f             pop     rdi
00007ff7`706a49f9 c3             ret
As we can see, we’ll be calling USER32!LoadStringW again (as it’s @ 7FF77073D940h) to get some other string from the module via Resource ID (check documentation if confused). Because shortly after we are calling RET (function return – OP Code 0xc3), it looks like the function we are currently in of this process, is just loading string resources probably … and nothing more interesting than that. So, what will happen afterwards?! …
Now, let’s step over this and continue from its calling function @ SomeProc+0x100e26 and also confirm that the previous function returned the string we are expecting – just for sanity check and understanding:
0:000> t
SomeProc+0x100e26:
00007ff7`70700e26 488bd0          mov     rdx,rax

0:000> du @rax
00007ff7`707cd010  "evaluation copy"
Stepping a little further, we end up with an interesting place where we are loading 0x200 (= 512 … interesint) into R9 register and then call another function:
0:000> u @rip
SomeProc+0x100e2e:
00007ff7`70700e2e 41b800020000    mov     r8d,200h
00007ff7`70700e34 e8ab9bfaff      call    SomeProc+0xaa9e4 (00007ff7`706aa9e4)
00007ff7`70700e39 4c8bc7          mov     r8,rdi
00007ff7`70700e3c 488d1521f90400  lea     rdx,[SomeProc+0x150764 (00007ff7`70750764)]
00007ff7`70700e43 488d8c2420040000 lea     rcx,[rsp+420h]
00007ff7`70700e4b e86c9bfaff      call    SomeProc+0xaa9bc (00007ff7`706aa9bc)
00007ff7`70700e50 4c8bc7          mov     r8,rdi
00007ff7`70700e53 488d542420      lea     rdx,[rsp+20h]
We will unassemble (as we know from the CALL instruction that this () will be the function entrypoint – so we unasssemble using “uf” to see the entire function:
0:000> uf SomeProc+0xaa9e4
SomeProc+0xaa9e4:
00007ff7`706aa9e4 4533c9          xor     r9d,r9d
00007ff7`706aa9e7 4d85c0          test    r8,r8
00007ff7`706aa9ea 7423            je      SomeProc+0xaaa0f (00007ff7`706aaa0f)  Branch

SomeProc+0xaa9ec:
00007ff7`706aa9ec 4983e801        sub     r8,1
00007ff7`706aa9f0 7419            je      SomeProc+0xaaa0b (00007ff7`706aaa0b)  Branch

SomeProc+0xaa9f2:
00007ff7`706aa9f2 482bd1          sub     rdx,rcx

SomeProc+0xaa9f5:
00007ff7`706aa9f5 0fb7040a        movzx   eax,word ptr [rdx+rcx]
00007ff7`706aa9f9 6685c0          test    ax,ax
00007ff7`706aa9fc 740d            je      SomeProc+0xaaa0b (00007ff7`706aaa0b)  Branch

SomeProc+0xaa9fe:
00007ff7`706aa9fe 668901          mov     word ptr [rcx],ax
00007ff7`706aaa01 4883c102        add     rcx,2
00007ff7`706aaa05 4983e801        sub     r8,1
00007ff7`706aaa09 75ea            jne     SomeProc+0xaa9f5 (00007ff7`706aa9f5)  Branch

SomeProc+0xaaa0b:
00007ff7`706aaa0b 66448909        mov     word ptr [rcx],r9w

SomeProc+0xaaa0f:
00007ff7`706aaa0f c3              ret  Branch
So … now follows a loooong process of stepping through the code and anlyzing what it does next until we hoooopefully reach an interesting point which would give us some hints or something …

After stepping from call to call and code and so on (we can use “pc” to step-jump from call to call), I ended up in USER32.dll which is part of the Windows GUI, so we are already starting the actual UI and passing Windows Messeges (ended up in USER32!SendMessageW) – that (most likely) means that we are past the place of interest where the “validation verification registration key whatever …” was done … – but … at last by comparing stacks from before (see in snippets from above), we can see that the (or rather one of the) “bigger” most important handling / decision making functions, might be somewhere around @ SomeProc+0x10163a because this was on the stack while we were loading the “evaluation copy” string and during many other function SomeProc owned calls and now we ended up in USER32.dll and it’s still on the stack:
0:000> k
 # Child-SP          RetAddr               Call Site
00 000000a7`061d84e8 00007ff7`7065a012     USER32!SendMessageW
01 000000a7`061d84f0 00007ff7`7070163a     SomeProc+0x5a012
02 000000a7`061dcb00 00007ff7`707188c2     SomeProc+0x10163a
03 000000a7`061dfc30 00007ffa`b8ed26bd     SomeProc+0x1188c2
04 000000a7`061dfc70 00007ffa`ba66dfb8     KERNEL32!BaseThreadInitThunk+0x1d
05 000000a7`061dfca0 00000000`00000000     ntdll!RtlUserThreadStart+0x28
So, I noted down an interesting place (function) to look at closer and I’ve noticed that it’s being called multiple times SomeProc+0xaa9e4 (check/search in above snippets for it). What I’ve noticed was that at some point, between calls to it, at some point we load bcryptPrimitives.dll DLL which is a Windows DLL that is used for cryptographic services (encryption/decryption/etc.) – as can also be seen if we display the module information for it:
0:000> lmDvm bcryptPrimitives
Browse full module list
start             end                 module name
00007ffa`b7f60000 00007ffa`b7fdb000   bcryptPrimitives   (deferred)
    Image path: C:\WINDOWS\System32\bcryptPrimitives.dll
    Image name: bcryptPrimitives.dll
    Browse all global symbols  functions  data
    Image was built with /Brepro flag.
    Timestamp:        46D130CD (This is a reproducible build file hash, not a timestamp)
    CheckSum:         0008638E
    ImageSize:        0007B000
    File version:     10.0.22621.1105
    Product version:  10.0.22621.1105
    File flags:       0 (Mask 3F)
    File OS:          40004 NT Win32
    File type:        2.0 Dll
    File date:        00000000.00000000
    Translations:     0409.04b0
    Information from resource tables:
        CompanyName:      Microsoft Corporation
        ProductName:      Microsoft® Windows® Operating System
        InternalName:     bcryptprimitives.dll
        OriginalFilename: bcryptprimitives.dll
        ProductVersion:   10.0.22621.1105
        FileVersion:      10.0.22621.1105 (WinBuild.160101.0800)
        FileDescription:  Windows Cryptographic Primitives Library
        LegalCopyright:   © Microsoft Corporation. All rights reserved.
So, let’s restart (.restart) the process under the debugger, set a breakpoint on SomeProc+0xaa9e4 and see how many times it is called and when the bcryptPrimitives.dll DLL is loaded during these calls (seems to be on the 5th call):
0:000> .restart

0:000> bp SomeProc+0xaa9e4

0:000> g
ModLoad: 00007ffa`b9180000 00007ffa`b91b2000   C:\WINDOWS\System32\IMM32.DLL
ModLoad: 00007ffa`b6900000 00007ffa`b6913000   C:\WINDOWS\SYSTEM32\UMPDC.dll
Breakpoint 0 hit
SomeProc+0xaa9e4:
00007ff7`706aa9e4 4533c9          xor     r9d,r9d

0:000> g
Breakpoint 0 hit
SomeProc+0xaa9e4:
00007ff7`706aa9e4 4533c9          xor     r9d,r9d

0:000> g
Breakpoint 0 hit
SomeProc+0xaa9e4:
00007ff7`706aa9e4 4533c9          xor     r9d,r9d

0:000> g
ModLoad: 00007ffa`b5a20000 00007ffa`b62e8000   C:\WINDOWS\SYSTEM32\windows.storage.dll
ModLoad: 00007ffa`b58e0000 00007ffa`b5a1e000   C:\WINDOWS\SYSTEM32\wintypes.dll
ModLoad: 00007ffa`b6b50000 00007ffa`b6b68000   C:\WINDOWS\SYSTEM32\kernel.appcore.dll
ModLoad: 00007ffa`b7f60000 00007ffa`b7fdb000   C:\WINDOWS\System32\bcryptPrimitives.dll
ModLoad: 00007ffa`b7700000 00007ffa`b774e000   C:\WINDOWS\SYSTEM32\CFGMGR32.dll
ModLoad: 00007ffa`b8d10000 00007ffa`b8dc0000   C:\WINDOWS\System32\clbcatq.dll
ModLoad: 00007ffa`b3120000 00007ffa`b3220000   C:\WINDOWS\system32\propsys.dll
ModLoad: 00007ffa`b8f90000 00007ffa`b9034000   C:\WINDOWS\System32\sechost.dll
ModLoad: 00007ffa`81da0000 00007ffa`81e40000   C:\Windows\System32\Windows.FileExplorer.Common.dll
ModLoad: 00007ffa`a97f0000 00007ffa`a98db000   C:\Windows\System32\Windows.StateRepositoryPS.dll
ModLoad: 00007ffa`aecc0000 00007ffa`aecfd000   C:\WINDOWS\SYSTEM32\windows.staterepositoryclient.dll
ModLoad: 00007ffa`b7980000 00007ffa`b79a1000   C:\WINDOWS\SYSTEM32\profapi.dll
ModLoad: 00007ffa`afd20000 00007ffa`afd3e000   C:\WINDOWS\SYSTEM32\MPR.dll
ModLoad: 00007ffa`9feb0000 00007ffa`9fed9000   C:\WINDOWS\System32\p9np.dll
ModLoad: 00007ffa`b1b40000 00007ffa`b1b4c000   C:\WINDOWS\System32\drprov.dll
ModLoad: 00007ffa`aaee0000 00007ffa`aaef9000   C:\WINDOWS\System32\ntlanman.dll
ModLoad: 00007ffa`aad50000 00007ffa`aad6f000   C:\WINDOWS\System32\davclnt.dll
ModLoad: 00007ffa`b6580000 00007ffa`b65e6000   C:\WINDOWS\System32\WINSTA.dll
ModLoad: 00007ffa`b04b0000 00007ffa`b04ca000   C:\WINDOWS\System32\wkscli.dll
ModLoad: 00007ffa`ab8b0000 00007ffa`ab8c2000   C:\WINDOWS\SYSTEM32\cscapi.dll
ModLoad: 00007ffa`b6530000 00007ffa`b653c000   C:\WINDOWS\System32\netutils.dll
ModLoad: 00007ffa`b4e90000 00007ffa`b4f27000   C:\WINDOWS\SYSTEM32\apphelp.dll
ModLoad: 00007ffa`81af0000 00007ffa`81b0a000   C:\WINDOWS\system32\NetworkExplorer.dll
Breakpoint 0 hit
SomeProc+0xaa9e4:
00007ff7`706aa9e4 4533c9          xor     r9d,r9d

0:000> k
 # Child-SP          RetAddr               Call Site
00 00000018`3aafbd78 00007ff7`706aa9df     SomeProc+0xaa9e4
01 00000018`3aafbd80 00007ff7`70694243     SomeProc+0xaa9df
02 00000018`3aafbdb0 00007ff7`706ba059     SomeProc+0x94243
03 00000018`3aafbe00 00007ff7`706b990d     SomeProc+0xba059
04 00000018`3aafbf40 00007ff7`706ba249     SomeProc+0xb990d
05 00000018`3aafbf70 00007ff7`706b9ef1     SomeProc+0xba249
06 00000018`3aafbfa0 00007ff7`706b986a     SomeProc+0xb9ef1
07 00000018`3aafc810 00007ff7`70700f60     SomeProc+0xb986a
08 00000018`3aafcc70 00007ff7`707188c2     SomeProc+0x100f60
09 00000018`3aaffda0 00007ffa`b8ed26bd     SomeProc+0x1188c2
0a 00000018`3aaffde0 00007ffa`ba66dfb8     KERNEL32!BaseThreadInitThunk+0x1d
0b 00000018`3aaffe10 00000000`00000000     ntdll!RtlUserThreadStart+0x28
Now … on the 11th call to SomeProc+0xaa9e4, it looks like we load the ADVAPI32.dll DLL which is a Windows DLL responsible for a couple of things, but, most likely and usually used for interacting with the Windows Registry which makes things pretty interesting …
0:000> g
Breakpoint 0 hit
SomeProc+0xaa9e4:
00007ff7`706aa9e4 4533c9          xor     r9d,r9d

0:000> g
Breakpoint 0 hit
SomeProc+0xaa9e4:
00007ff7`706aa9e4 4533c9          xor     r9d,r9d

0:000> g
Breakpoint 0 hit
SomeProc+0xaa9e4:
00007ff7`706aa9e4 4533c9          xor     r9d,r9d

0:000> g
Breakpoint 0 hit
SomeProc+0xaa9e4:
00007ff7`706aa9e4 4533c9          xor     r9d,r9d

0:000> g
Breakpoint 0 hit
SomeProc+0xaa9e4:
00007ff7`706aa9e4 4533c9          xor     r9d,r9d

0:000> g
ModLoad: 00007ffa`b90c0000 00007ffa`b916e000   C:\WINDOWS\System32\ADVAPI32.dll
Breakpoint 0 hit
SomeProc+0xaa9e4:
00007ff7`706aa9e4 4533c9          xor     r9d,r9d
Let’s make a note of where we are currently (stack) so that we have all the interesting locations of SomeProc on the stack (that we might need later …):
0:000> k
 # Child-SP          RetAddr               Call Site
00 00000018`3aafcb88 00007ff7`706aa9df     SomeProc+0xaa9e4
01 00000018`3aafcb90 00007ff7`70694243     SomeProc+0xaa9df
02 00000018`3aafcbc0 00007ff7`70694558     SomeProc+0x94243
03 00000018`3aafcc10 00007ff7`70700f7d     SomeProc+0x94558
04 00000018`3aafcc70 00007ff7`707188c2     SomeProc+0x100f7d
05 00000018`3aaffda0 00007ffa`b8ed26bd     SomeProc+0x1188c2
06 00000018`3aaffde0 00007ffa`ba66dfb8     KERNEL32!BaseThreadInitThunk+0x1d
07 00000018`3aaffe10 00000000`00000000     ntdll!RtlUserThreadStart+0x28
One might think it’s a good idea to open Process Monitor and also monitor Registry activity of the process …
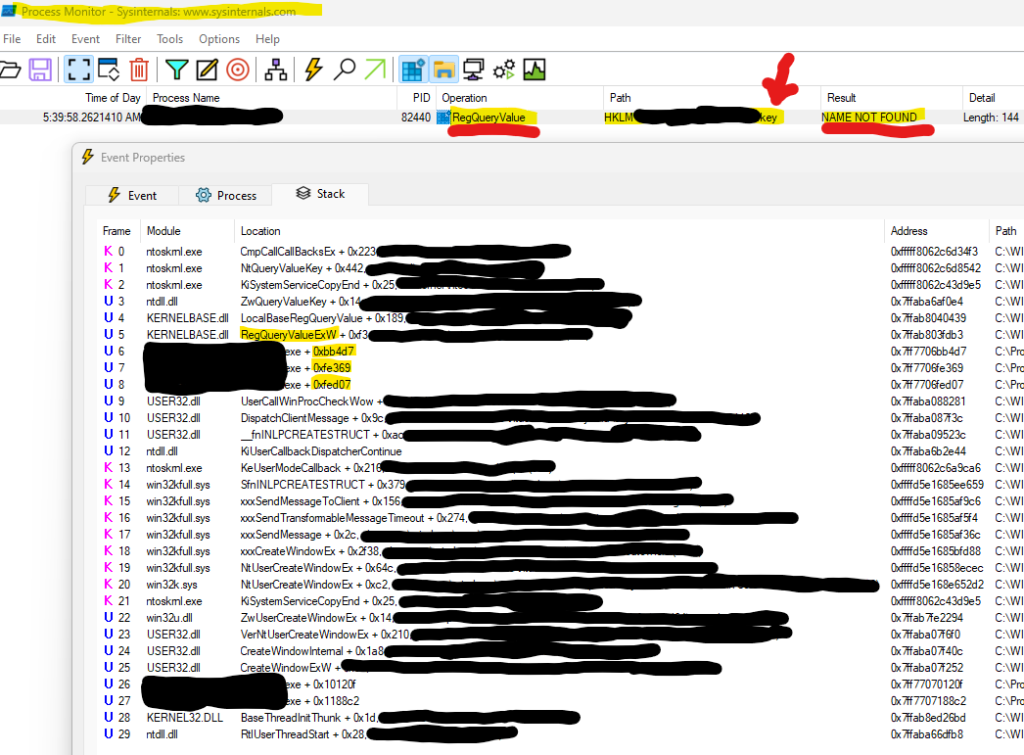
Well, well, well, isn’t this interesting? … =)) Looks like SomeProc is checking (most probably that’s where it is saving it as well – encrypted … thus cryptographic services needed) if the serial/key is saved in the Registry. We can see that it was not found (it does not exist – thus “NAME NOT FOUND” result) which of course makes total sense because I haven’t entered it … it’s in evaluation copy still.
I have narrowed it down to this key because it’s called “snkey” (so it has “key” in its name) which is a pretty big hint + the fact that it was not found (because it’s not entered).
Well … noting down these addresses and setting some breakpoints on them (and others noted before) and continuing investigation …
0:000> bp SomeProc+0xbb4d7
0:000> bp SomeProc+0xbb5ae
0:000> bp SomeProc+0xfe390
0:000> bp SomeProc+0xfed07
0:000> bp SomeProc+0xfe369
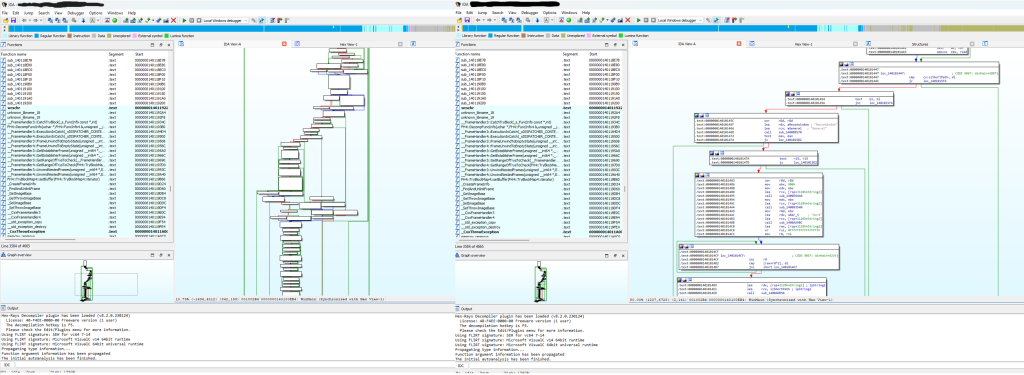
I think it’s time to look at these and at the flow in IDA – can’t show you too much there because I would have to censor too much – but so that you can see the tool a little, here it is – point being that it makes a very cool call graph amongst MANY other things and its one of the TOP reverse engineering and malware analysis tools out there:
So, continuing my investigation …

After playing around and analyzing assembly for an eternity … and trying out different places and changing return values on different comparisons and so on … I’ve finally gotten to the correct place (luck was also a big factor of course …) – here we are – this is where I’ve found a good spot to modify the values so that the final check if the application is registered or not, got SUCCESS, hehe …
0:000> g
Breakpoint 4 hit
SomeProc+0xfed07:
00007ff7`706fed07 8ac8            mov     cl,al

0:000> r @al
al=0

0:000> u SomeProc+0xfed07
SomeProc+0xfed07:
00007ff7`706fed07 8ac8            mov     cl,al
00007ff7`706fed09 e81666f7ff      call    SomeProc+0x75324 (00007ff7`70675324)
00007ff7`706fed0e e991150000      jmp     SomeProc+0x1002a4 (00007ff7`707002a4)
00007ff7`706fed13 66443bfe        cmp     r15w,si
00007ff7`706fed17 0f85f9130000    jne     SomeProc+0x100116 (00007ff7`70700116)
00007ff7`706fed1d e89e7afeff      call    SomeProc+0xe67c0 (00007ff7`706e67c0)
00007ff7`706fed22 84c0            test    al,al
00007ff7`706fed24 0f85c1130000    jne     SomeProc+0x1000eb (00007ff7`707000eb)

0:000> r @al = 1

0:000> r @al
al=1

0:000> p
SomeProc+0xfed09:
00007ff7`706fed09 e81666f7ff      call    SomeProc+0x75324 (00007ff7`70675324)

0:000> r @cl
cl=1

0:000> t
SomeProc+0x75324:
00007ff7`70675324 880df6dc1400    mov     byte ptr [SomeProc+0x1c3020 (00007ff7`707c3020)],cl ds:00007ff7`707c3020=00

0:000> db SomeProc+0x1c3020 l1
00007ff7`707c3020  00                                               .

0:000> p
SomeProc+0x7532a:
00007ff7`7067532a c3              ret

0:000> db SomeProc+0x1c3020 l1
00007ff7`707c3020  01
Too bad I cannot show you screenshots of the application and/or of my face now to see the happyness combined with massive tiredness from no sleep =))
At this point as a generic example, the image can be patched so that we skip the instructions that we don’t want to execute (in this simple example – a CMD & JMP) and replace them with a NOP operation (0x90) with any language you like – a simple PowerShell for example:
$bytes  = [System.IO.File]::ReadAllBytes("C:\SomeProc.exe") # full path to image here
# depending on OPCODE sizes that need to be replaced, after finding the correct offset
$offset = 0x12345 # offset of OPCODE where to start
$bytes[$offset]   = 0x90 # patch with 0x90 - NOP operation to skip instruction
$bytes[$offset + 2] = 0x90  # patch with 0x90 - NOP operation to skip instruction
[System.IO.File]::WriteAllBytes("C:\SomeProc.exe", $bytes)